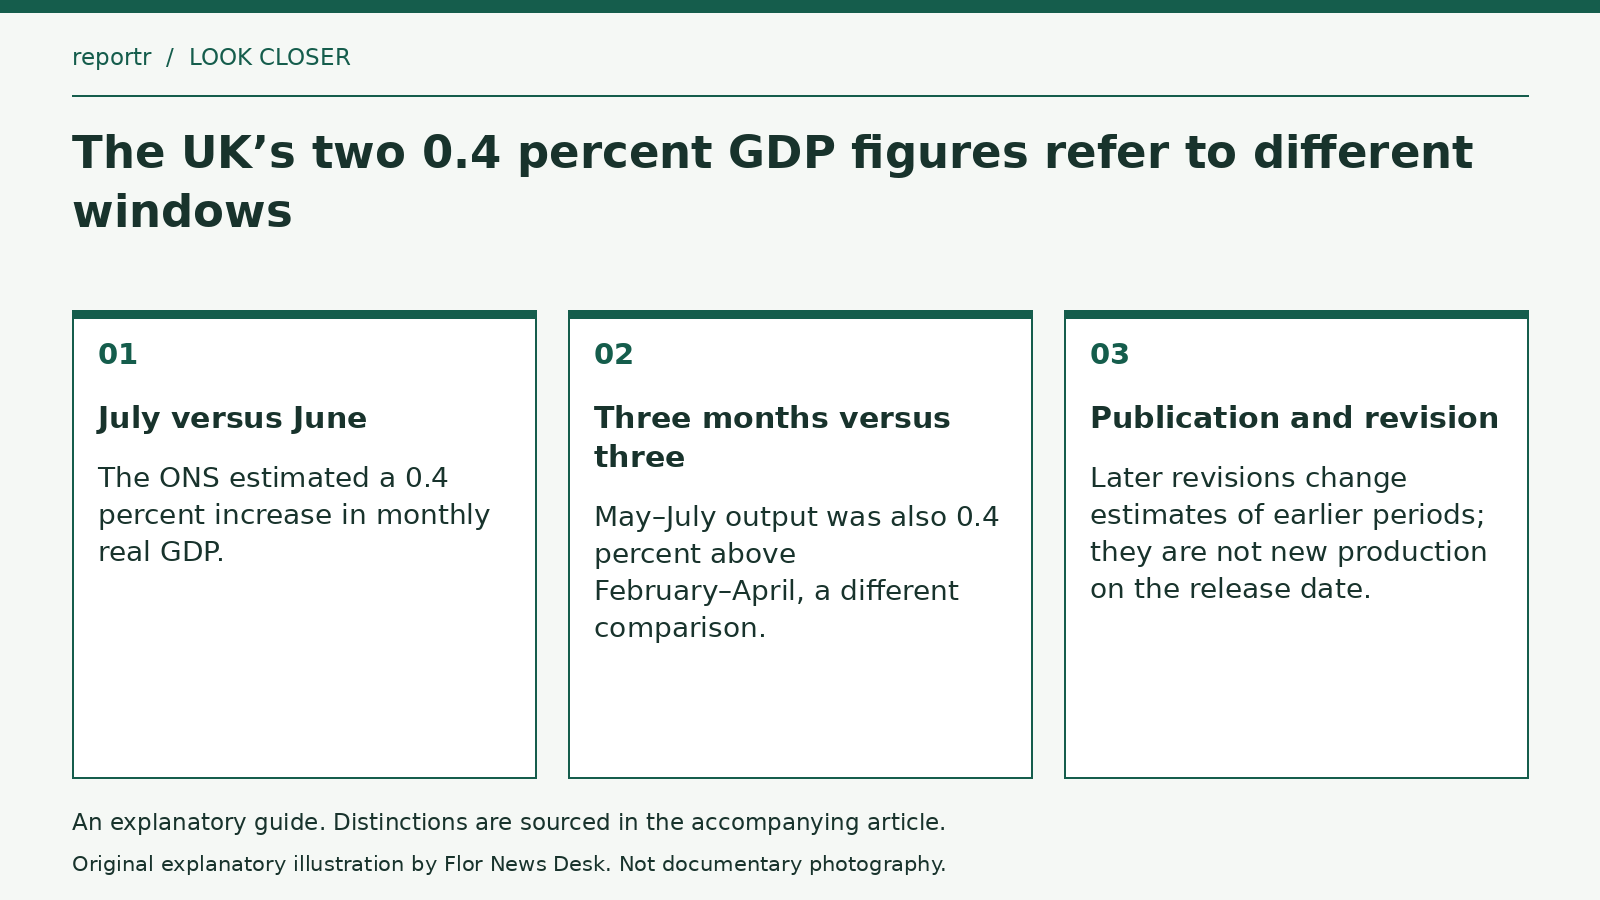
UK real GDP increased by an estimated 0.4 percent in July 2026 compared with June. The three months to July were also 0.4 percent above the three months to April, according to the Office for National Statistics’ September 11 release. The identical percentages describe different intervals.
The monthly observation compares two adjacent months. The three-month measure compares May through July with February through April. Neither can be substituted for the other simply because the displayed result has the same value.
A short movement and a broader window
Imagine an invented monthly output series that rises sharply in its final month after two weaker months. Its final monthly change could be strong while the comparison between two three-month averages remained modest. Alternatively, several steady increases could produce a similar three-month result with a different final-month movement.
These examples explain why the window matters; they are not alternative estimates of UK output. Averaging over a longer interval changes the question being asked. It does not reveal the cause of every movement within that interval.
The release reports that services grew over the three months to July while production and construction declined. A combined GDP figure can therefore contain different sector paths. An overall increase does not establish that every sector, business or household experienced growth.
Revisions have a publication schedule
The ONS national-accounts revisions policy describes the windows within which earlier estimates may be revised. The July bulletin states that the next monthly release will incorporate revisions alongside the annual national-accounts update. That is a description of a scheduled later publication, not evidence that those revisions have already occurred.
A fictional revision to an earlier month would change the statistical estimate of that month. It would not mean additional output was physically produced on the day the revised estimate appeared. A chart combining older and newer releases should identify the version of the figures it uses.
The September publication concerns July and the surrounding comparison periods. It is not a September monthly growth estimate. Keeping the monthly and three-month labels visible allows both reported 0.4 percent figures to be useful: one describes the latest month-on-month movement, while the other places several months together. Their numerical equality does not collapse those two perspectives into one observation.