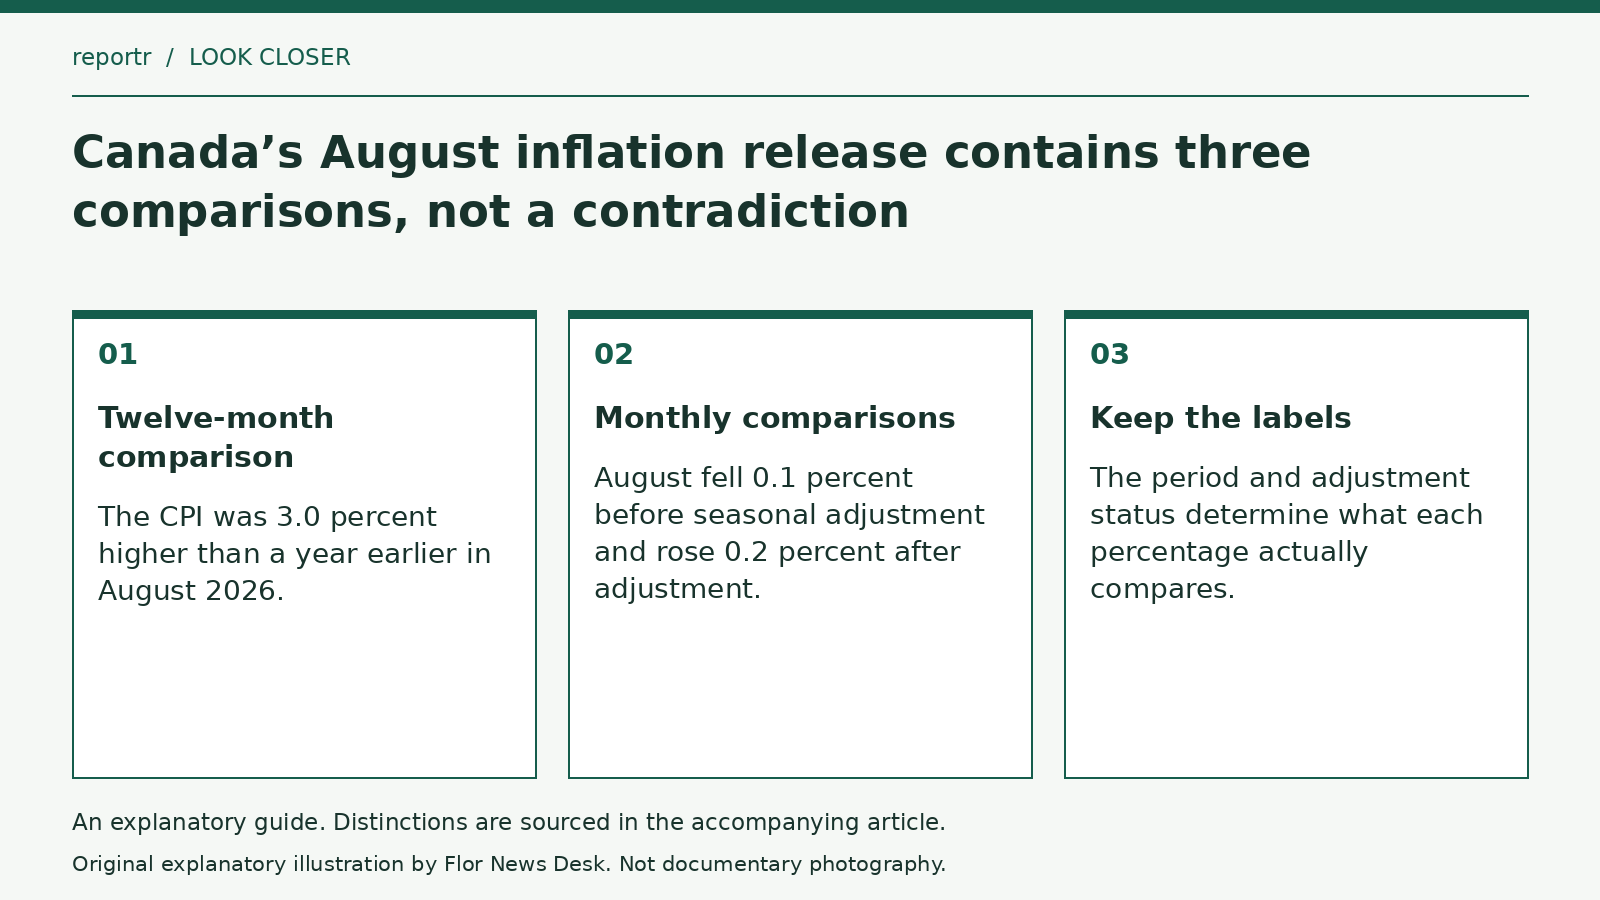
Canada’s Consumer Price Index rose 3.0 percent over the twelve months to August 2026, the same annual rate as July. Yet the index fell 0.1 percent from July before seasonal adjustment and rose 0.2 percent after adjustment. Statistics Canada reported all three results in its September 14 release. They describe different comparisons rather than three answers to an identical calculation.
The annual change compares August with August a year earlier. The monthly change compares August with July. The adjusted monthly series is a separate statistical presentation; Statistics Canada publishes it in a dedicated monthly table. Removing either the time interval or adjustment label changes what a number appears to mean.
An unchanged rate does not mean unchanged prices
Consider an invented index that moves from 100 to 103 over a year. Its annual increase is 3 percent. Another year-long comparison from 110 to 113.3 also produces 3 percent. Identical growth rates do not require identical price levels. These figures illustrate the arithmetic and are not additional Canadian observations.
There is a similar trap in reading a slower increase as a fall. An illustrative price rising from $10 to $11 has increased by 10 percent. A subsequent rise to $11.55 is a 5 percent increase: growth has slowed, but the price is higher. A statement about the pace of change therefore cannot substitute for a statement about the amount charged.
The headline also combines different components
The August release reports that inflation excluding gasoline reached 2.4 percent, up from 2.2 percent in July. The all-items rate nevertheless stayed at 3.0 percent. This is a reminder that a stable combined indicator can contain movements in opposite directions. It does not imply every household’s expenses followed the same path.
In a simplified two-category budget, a person spending most of their money in the faster-rising category would experience something different from a person concentrated in the slower one. The example identifies information needed for a personal comparison; it is not a household inflation estimate.
For a chart or headline, the minimum useful label is consequently more than a percentage. It should identify the measure, the comparison period and whether the monthly data are adjusted. The September release describes August prices. None of its three comparisons supplies the still-unreleased result for September or establishes a future interest-rate decision.