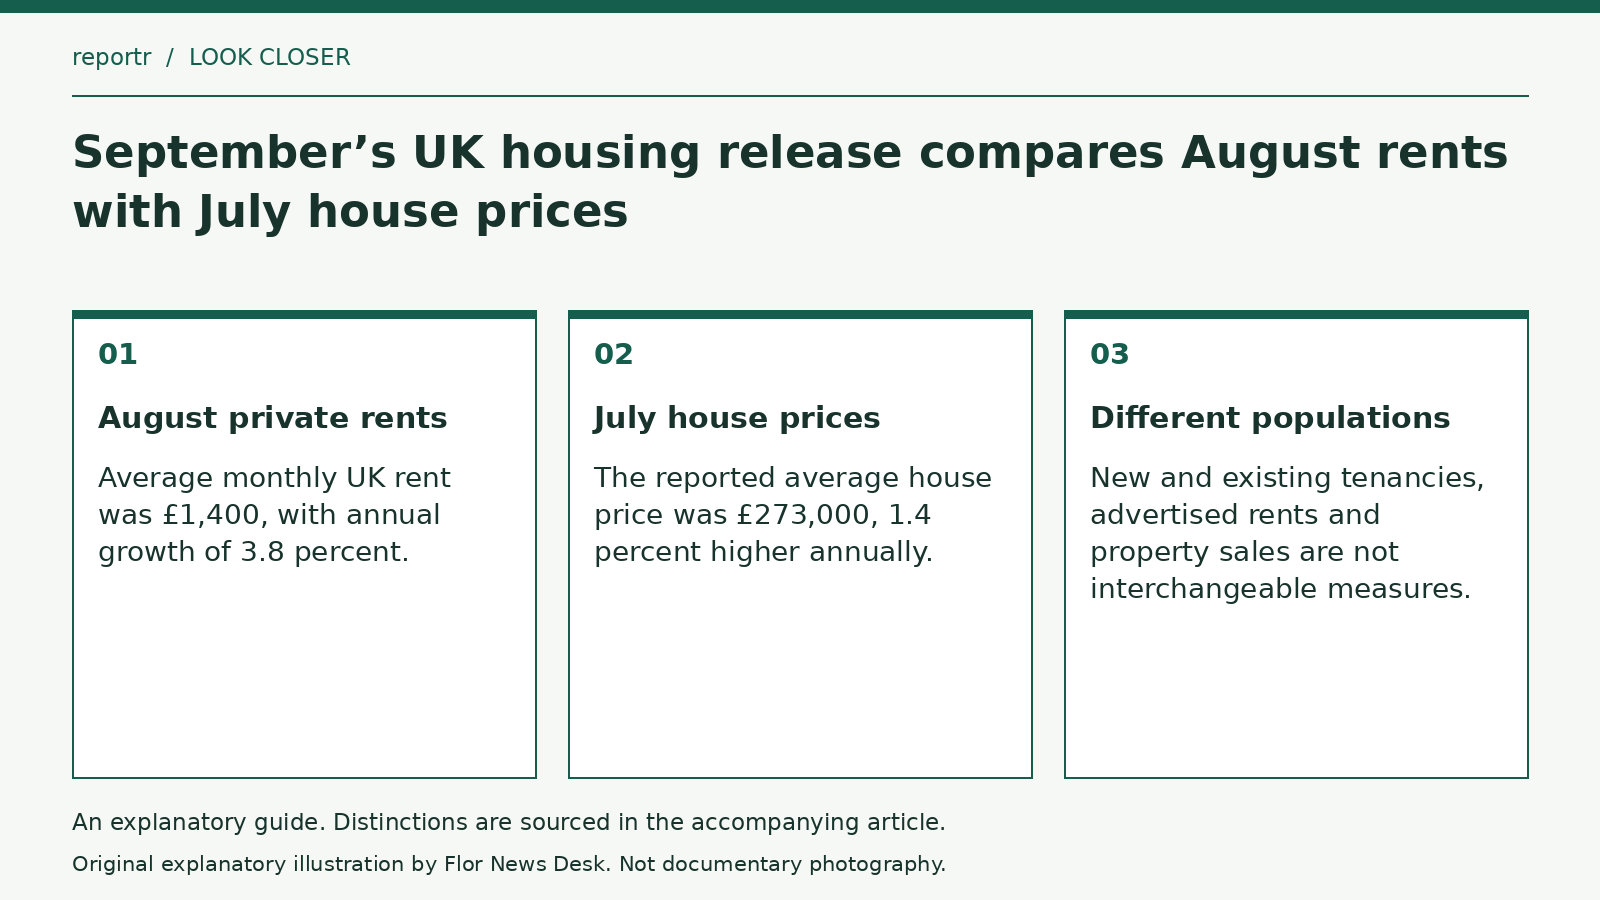
Average UK private rent was £1,400 per month in August 2026, 3.8 percent higher than a year earlier. Average house prices were £273,000 in July, up 1.4 percent annually. Both appear in the ONS September 16 housing release, but their shared publication date does not give them a shared reference month.
Rent is a recurring payment for using a property. A house price concerns acquiring one. Dividing or comparing those two headline averages without establishing their populations and methods would not produce a verified return on a particular property.
New and continuing tenancies
The private-rent measure covers new and existing tenancies. It therefore should not be described simply as the average advertised asking rent confronting a person searching for a new home. Those are different populations, even when their figures concern the same broad location.
Imagine a fictional rental market in which continuing tenants pay one amount and newly advertised properties carry another. A measure combining tenancies could change more slowly than a measure concentrating on current advertisements. The illustration is not an estimate of the size or direction of that difference in the UK.
The ONS monthly rental-statistics dataset publishes indices, annual percentage changes and average levels in dated editions. These quantities describe different aspects of the series. A rate of increase cannot replace a price level, just as a national average cannot establish the rent due under an individual agreement.
National figures contain timing qualifications
The September bulletin explains that Northern Ireland rental information has a longer lag and that the latest UK figures include estimates subject to revision. This is a stated feature of the published series, not evidence that the entire release is invalid. It is a reason to retain its methodological and timing notes when comparing later editions.
In a hypothetical chart, labelling all values September merely because they were released that month would move observations forward on the timeline. A reader might then compare them with genuinely September data and draw an unsupported conclusion about simultaneous change.
The release is most informative when its labels remain attached: August private rents, July house prices, and a September publication. It describes two parts of the housing market rather than one complete measure of housing affordability. Income, financing arrangements and the circumstances of a specific household remain separate questions that these headline averages do not answer.