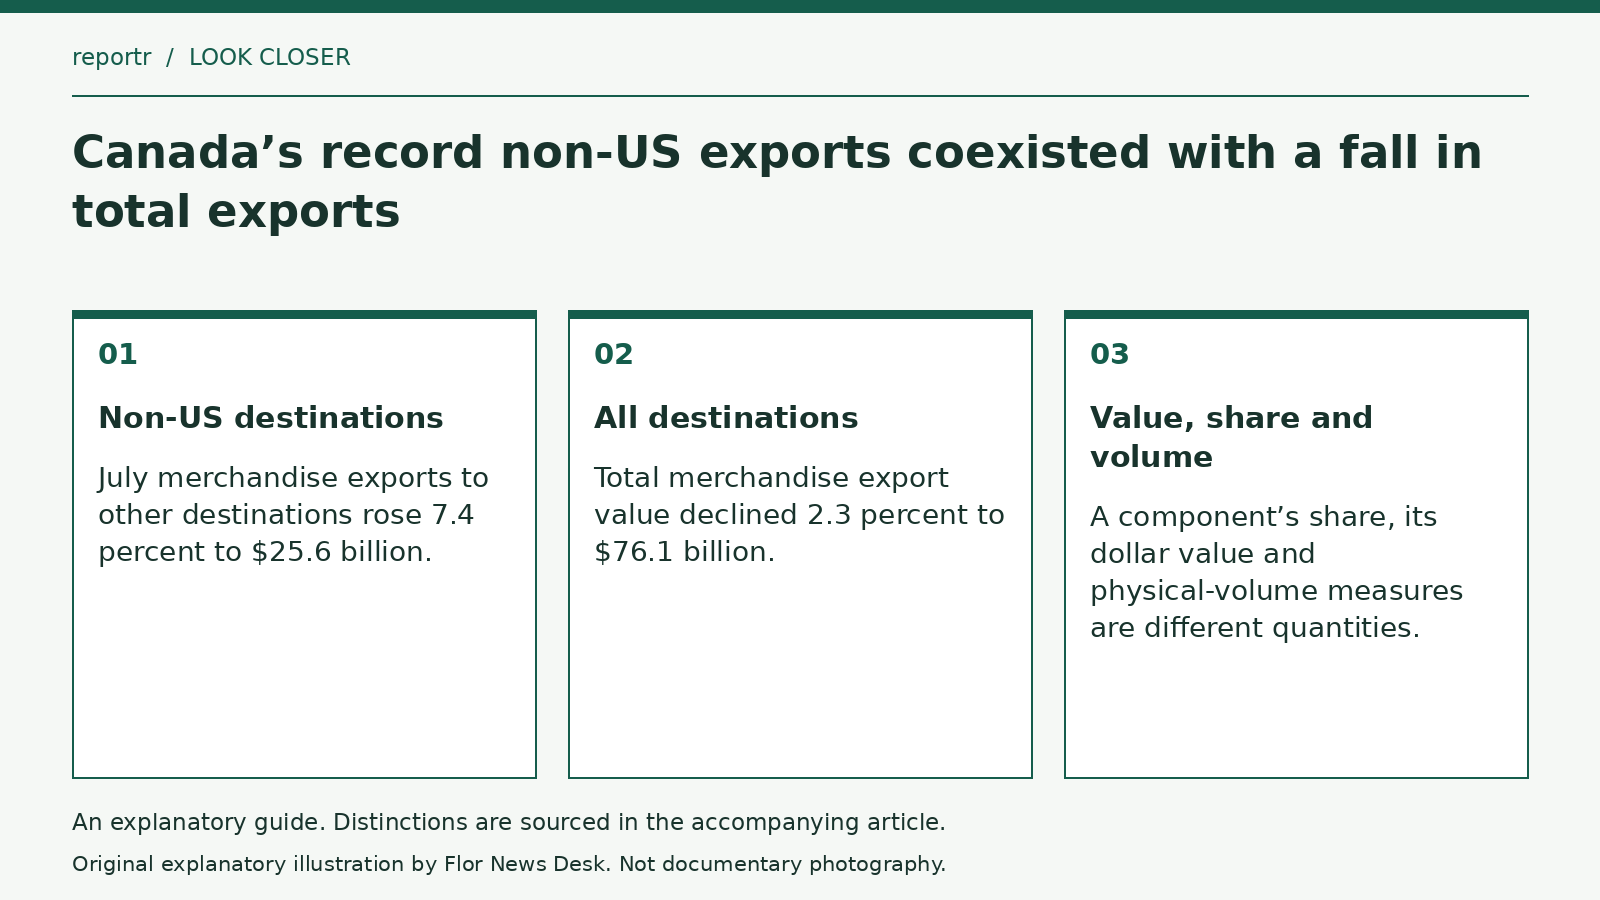
Canadian merchandise exports to countries other than the United States increased 7.4 percent to a record $25.6 billion in July 2026. Total merchandise exports nevertheless declined 2.3 percent to $76.1 billion. Both observations appear in Statistics Canada’s September 3 trade release. A growing component does not require a growing total.
The release put non-US destinations at 33.7 percent of export value. That share describes the relationship between one part and the whole. It is not the percentage of Canadian businesses exporting to those destinations, nor the percentage of exported physical items sent there.
Separate the value from the share
An invented example makes the distinction clear. Suppose exports to one group rise from 20 to 22 units while total exports fall from 100 to 90. The group’s absolute value rises and its share rises from 20 percent to about 24.4 percent. The example is arithmetic, not a reconstruction of July’s destination totals.
A share could also rise without an increase in its numerator. An unchanged component of 20 would become a quarter of a total that fell to 80. A headline reporting only a larger share would not tell the reader which of these situations occurred. July’s release provides both value and change, allowing the actual movement to be identified.
Merchandise is not the entire external account
Statistics Canada’s trade-statistics notes distinguish merchandise trade from the wider balance of payments, which also includes services and other transactions. The notes explain why balance-of-payments merchandise figures involve adjustments to customs information. These definitions matter before combining numbers from differently labelled tables.
An export-value increase also should not be relabelled automatically as an increase in the quantity shipped. The July release separately reported a decline in export volumes. Dollar values and volume measures answer different questions; a value alone cannot identify both.
The figures concern July and were published in September. They do not measure September shipments or establish that the new destination pattern will persist. Reading the result accurately means retaining the component, denominator, valuation basis and reference month. The record non-US total is a meaningful part of the release, but it is not a substitute for the simultaneous decline in overall merchandise export value.