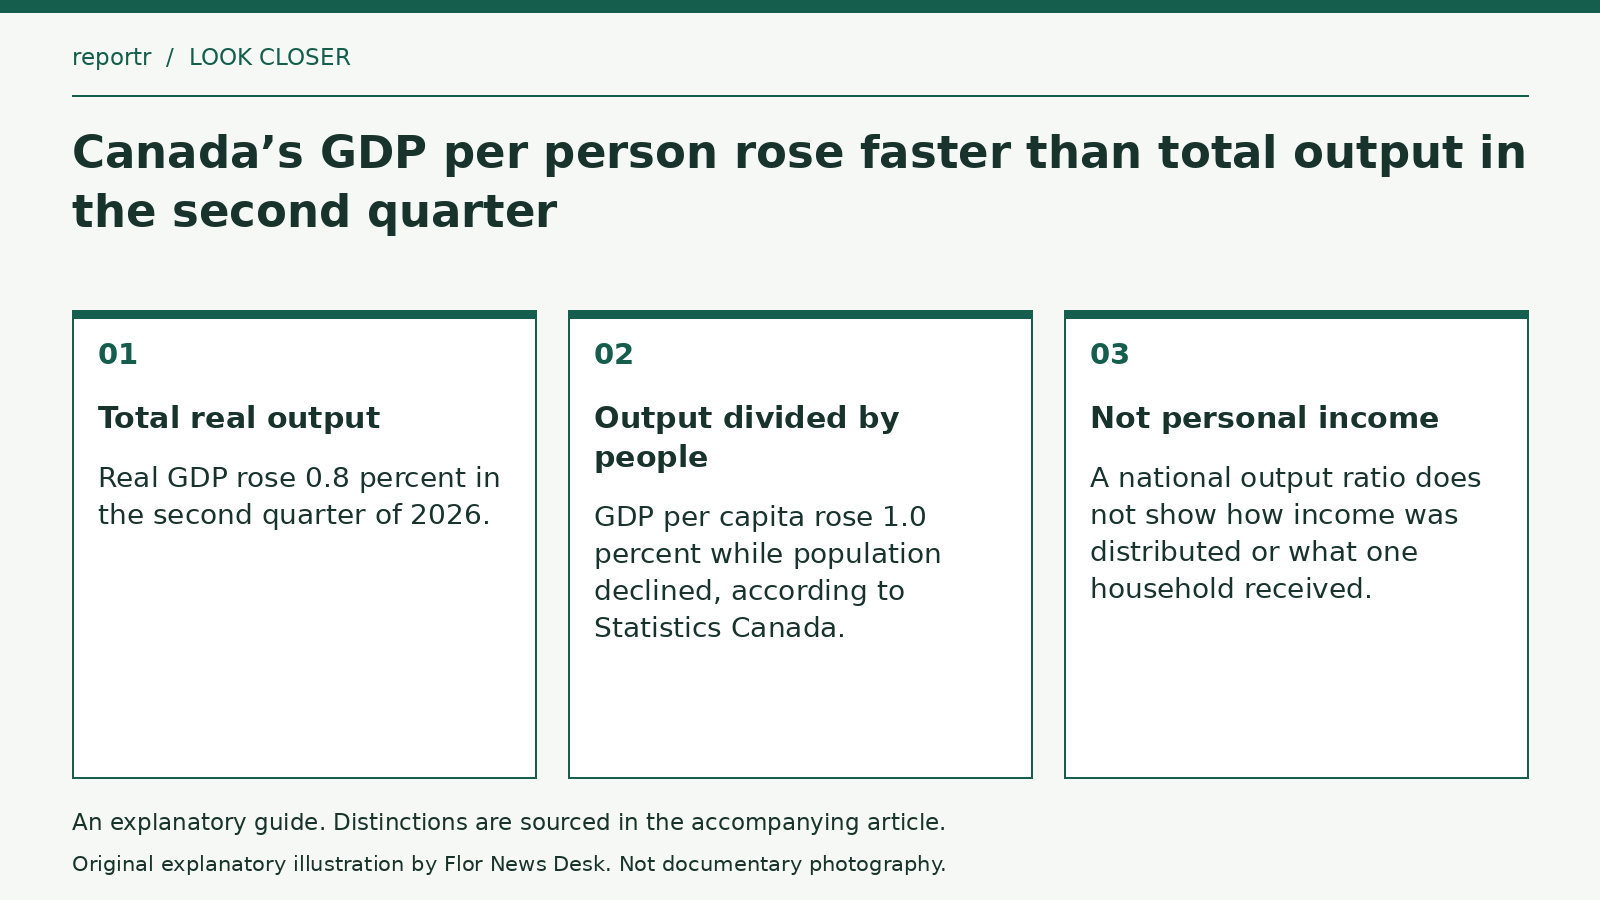
Canada’s real gross domestic product increased 0.8 percent in the second quarter of 2026, while output per person rose 1.0 percent. Statistics Canada’s August 28 release links the difference to a decline in population. The per-capita figure divides output by people; it does not represent a larger amount of production than the total measure.
The distinction can be demonstrated without estimating another Canadian statistic. Suppose an invented economy produces 1,000 units for 100 people, or 10 units per person. If output rises to 1,008 units and population falls to 99.8, output per person becomes about 10.10. Total production rose 0.8 percent while the ratio rose about 1 percent. The fictional numbers illustrate the calculation, not the official population estimate.
Output is not a household pay cheque
Statistics Canada’s national-accounts data guide describes accounts covering production, the incomes arising from it, expenditure, saving and investment. These are connected concepts, but they are not one interchangeable measure. Dividing production by population does not assign the result to each resident as cash.
Two imagined economies can have the same output per person while distributing income differently. A change in that ratio would not tell a reader which household gained, what happened to its housing costs or how many hours it worked. Those questions require their own observations.
Keep revisions and reference periods visible
The August release also revised first-quarter real GDP growth from 0.0 percent to 0.1 percent. That revision changes the estimate of an earlier period. It is not a separate burst of production that occurred on the date the revised number was published.
When comparing releases, it therefore matters whether both figures come from the same statistical version. An old first-quarter value placed beside a newer second-quarter value can conceal a revision even if each was accurately copied from its original release.
The second-quarter observation covers April through June. Publication in August does not make it an August growth rate, and the figures do not establish subsequent-quarter performance. The useful description retains the measure, time interval and version. Total GDP and GDP per capita illuminate different aspects of economic change; neither can stand alone as a complete assessment of living standards or of the experience of a particular family.