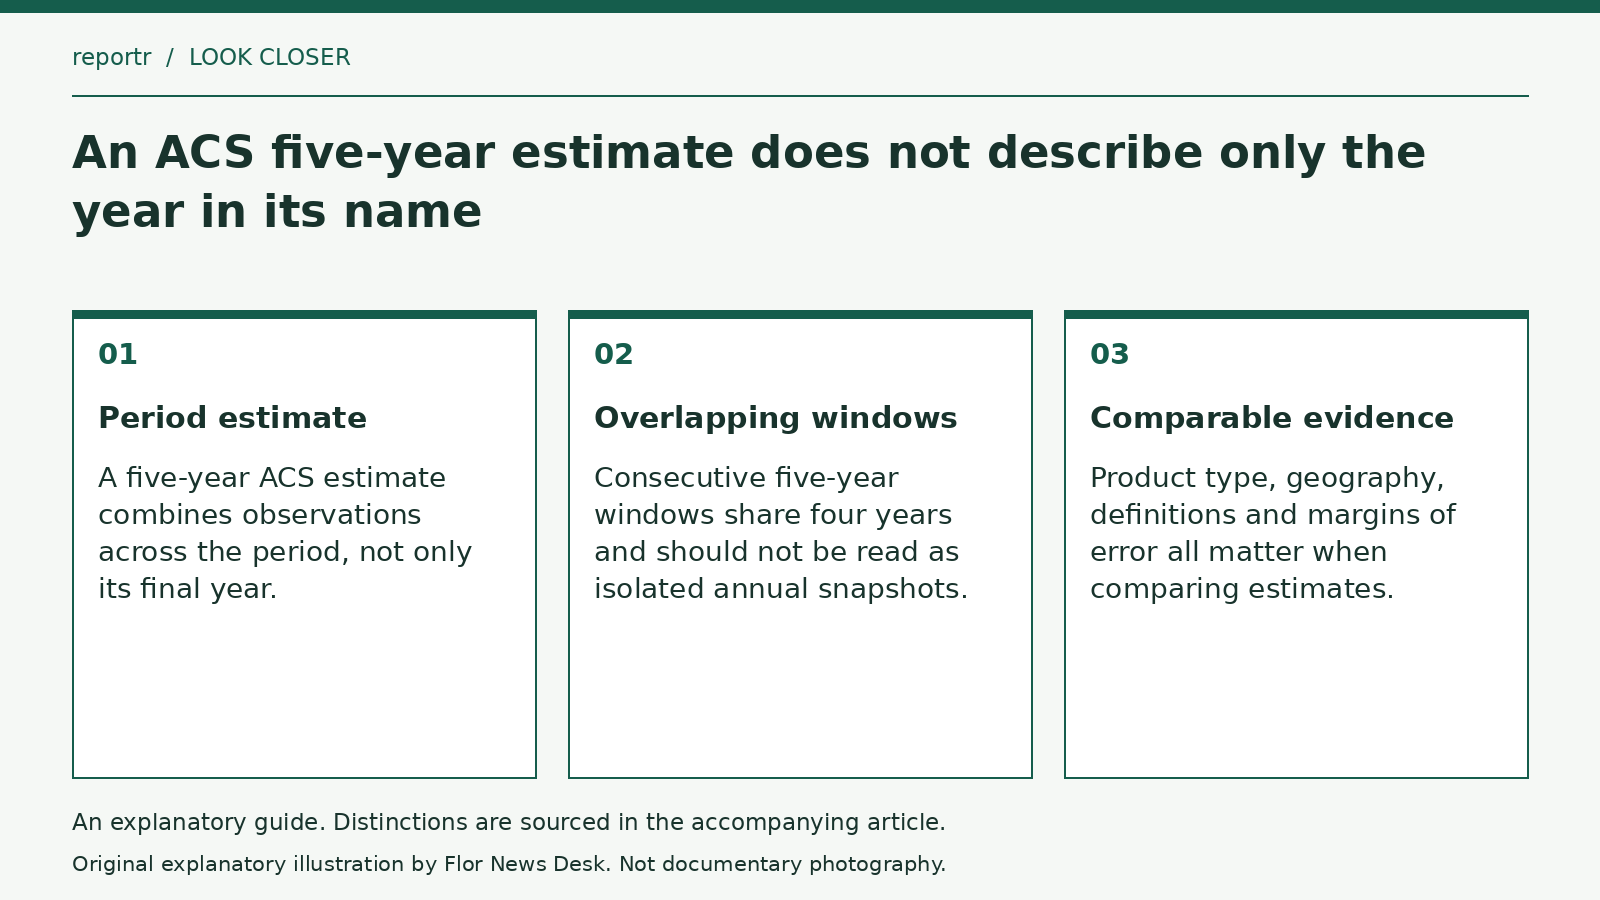
A five-year American Community Survey estimate describes a period of data collection, not a snapshot of the final year alone. The Census Bureau’s explanation of period estimates makes that distinction explicit. Pooling survey responses over five years is also different from calculating a simple average of five published annual estimates.
This is an existing methodological explanation, published in 2022, rather than a new survey result released in September 2026. Its continuing usefulness lies in interpreting the date ranges attached to local demographic and economic figures.
Shared years are shared information
Consider two hypothetical five-year periods: years one through five and years two through six. They share four years. Comparing their estimates as though they were observations of only years five and six would hide most of the underlying overlap. A change in the rolling estimate does not by itself describe the change that occurred during the last year.
The example concerns the structure of the comparison, not the values for any particular community. Even non-overlapping periods still require attention to geography, definitions and uncertainty before a difference is interpreted.
The bureau’s comparison guidance recommends comparing like products: one-year with one-year and five-year with five-year estimates. It also advises against comparing overlapping five-year periods and draws attention to the margins of error accompanying estimates. Those qualifications belong with the numbers, not only in a separate technical appendix.
Geographic labels need the same care
Imagine a fictional district whose boundary expands between two reporting periods. An increase in its estimated population could partly reflect the added area. A table containing the same district name would not establish that its geographic coverage was unchanged. The name, boundary and reference period need to be checked together.
Similarly, a small numerical difference between two estimates should not automatically be presented as a proven change. An estimate’s uncertainty affects what the comparison can establish. The margin of error is information about the estimate, not an optional decoration beside it.
The ACS provides information about community characteristics, while the bureau identifies its population-estimates programme as the preferred source for total population figures. The intended question therefore matters when selecting a dataset. A well-labelled comparison states the product, period, geography and uncertainty. Removing any of those can turn a valid survey estimate into a claim it was never designed to support.